Interest Coverage Ratio Explained: Can a PSX Company Afford Its Debt?
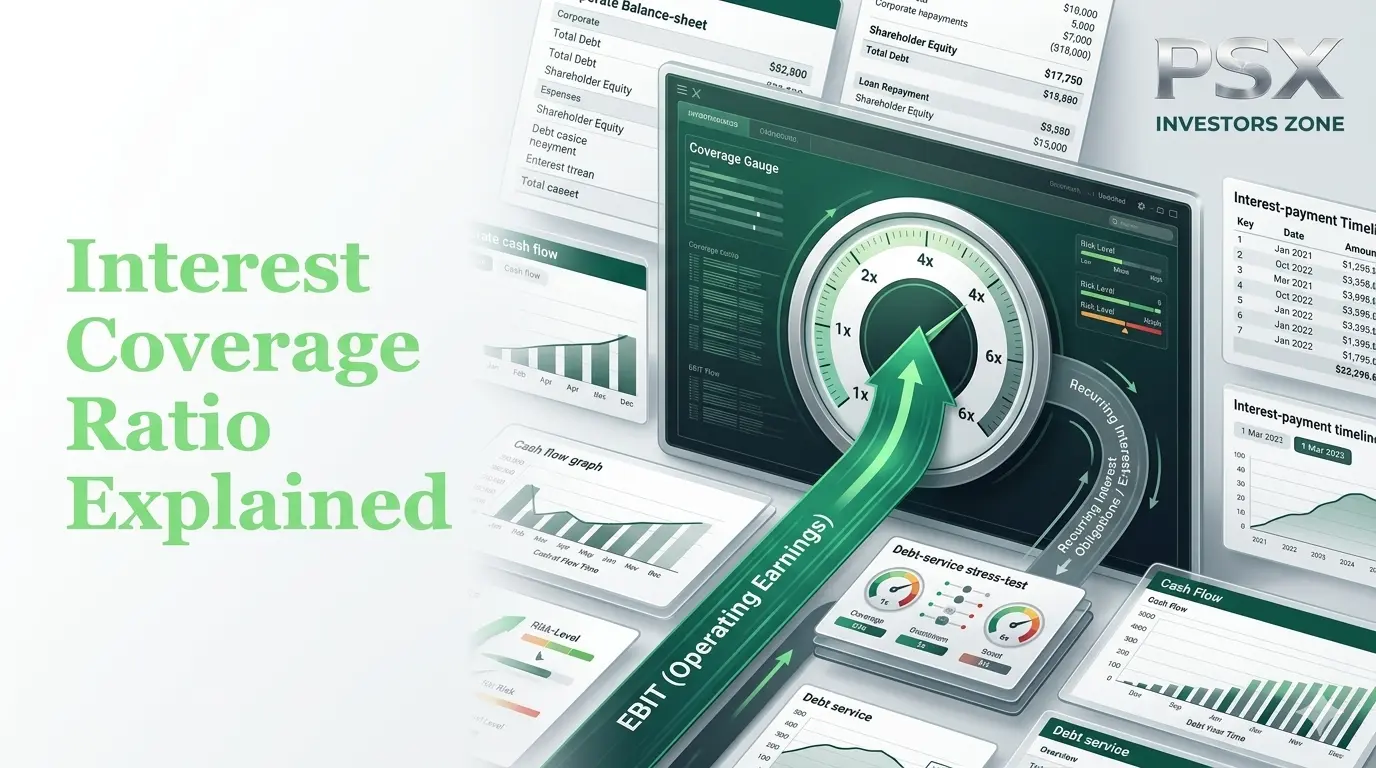
Debt can help a company expand, invest in new projects, and grow its business. But debt also creates a financial obligation: interest payments.
The important question for investors is not simply how much debt a company has.
The better question is:
Does the company generate enough operating profit to comfortably pay its interest expenses?
This is where the Interest Coverage Ratio becomes useful.
For investors analyzing companies listed on the Pakistan Stock Exchange (PSX), this ratio can provide an important indication of how comfortably a business can meet its interest obligations.
At PSX Investors Zone, we focus on practical financial education, fundamental analysis, and Shariah-compliant investing principles to help investors understand businesses before making investment decisions.
What Is the Interest Coverage Ratio?
The Interest Coverage Ratio measures a company's ability to pay the interest expenses on its debt using its operating earnings.
In simple terms:
It tells investors how many times a company's operating earnings can cover its interest expense.
A higher ratio generally indicates that a company has a greater ability to meet its interest obligations.
A lower ratio may indicate greater financial pressure.
Interest Coverage Ratio Formula
A commonly used formula is:
Interest Coverage Ratio = EBIT ÷ Interest Expense
Where:
- EBIT = Earnings Before Interest and Taxes
- Interest Expense = Interest payable on the company's debt and other applicable financing obligations
For example, if a company has Rs. 500 million in EBIT and Rs. 100 million in interest expense:
Interest Coverage Ratio = 500 ÷ 100 = 5 times
This means the company's EBIT covers its interest expense 5 times.
::contentReference[oaicite:0]{index=0}
Note: The visualization above illustrates interest compounding as a finance concept; the Interest Coverage Ratio itself is calculated using EBIT and interest expense.
What Does a High Interest Coverage Ratio Mean?
A high Interest Coverage Ratio generally means the company has a larger cushion between its operating earnings and interest obligations.
For example:
Interest Coverage Ratio = 8x
This means EBIT is approximately eight times the company's interest expense.
A stronger coverage ratio can indicate:
- Greater ability to service debt
- Lower immediate interest pressure
- More financial flexibility
- Better resilience against earnings declines
However, investors should still examine the company's overall debt and cash-flow position.
What Does a Low Interest Coverage Ratio Mean?
A low ratio means the company's operating earnings provide less coverage for its interest expenses.
For example:
Interest Coverage Ratio = 1.5x
The company generates approximately Rs. 1.50 of EBIT for every Rs. 1 of interest expense.
This leaves a smaller cushion if earnings decline.
A persistently low Interest Coverage Ratio can therefore be a warning sign that deserves further investigation.
What If the Interest Coverage Ratio Is Below 1?
A ratio below 1.0x means EBIT is lower than the company's interest expense.
For example:
- EBIT = Rs. 80 million
- Interest Expense = Rs. 100 million
Interest Coverage Ratio:
80 ÷ 100 = 0.8x
The company is not generating enough EBIT to cover its interest expense.
This does not automatically mean bankruptcy or immediate financial failure, because businesses can have other sources of cash and financing.
However, it is a significant indicator that investors should investigate carefully.
Is a Higher Interest Coverage Ratio Always Better?
Generally, stronger interest coverage provides a larger financial cushion.
But investors should not simply search for the company with the highest ratio.
A very high ratio may occur because a company uses little debt or because interest expenses are currently low.
Investors should also consider:
- Business growth
- Profitability
- Cash flow
- Debt maturity
- Capital expenditure
- Industry conditions
- Future interest costs
The appropriate level depends on the company's business model and industry.
Example: Comparing Two PSX Companies
Suppose two companies report:
| Company A | Company B | |
|---|---|---|
| EBIT | Rs. 1 Billion | Rs. 1 Billion |
| Interest Expense | Rs. 100M | Rs. 400M |
| Interest Coverage | 10x | 2.5x |
Both companies generate the same EBIT.
However, Company A has significantly greater interest coverage because it has lower interest expenses.
Company B has less room for earnings declines before interest payments become a larger concern.
Why Interest Coverage Matters for PSX Investors
Interest expenses can significantly affect a company's profitability.
A business may have:
- Strong revenue
- Growing sales
- Good operating margins
But if debt and interest costs become excessive, they can reduce the earnings available to shareholders.
This is why debt analysis should be part of fundamental stock research.
Interest Coverage Ratio and Debt-to-Equity Ratio
These two ratios measure different aspects of financial risk.
Debt-to-Equity Ratio
Measures the relationship between a company's debt and shareholders' equity.
Interest Coverage Ratio
Measures how comfortably the company's operating earnings cover interest expenses.
For example, a company can have moderate debt relative to equity but still experience pressure if its earnings decline sharply.
Likewise, a company with relatively high debt may still have strong interest coverage if its operating earnings are substantial and stable.
Using both ratios provides a more complete picture.
Interest Coverage Ratio vs Free Cash Flow
Interest Coverage Ratio is based on operating earnings, while Free Cash Flow focuses on cash generated after operating requirements and capital expenditures.
This distinction matters.
A company may report strong EBIT but have weaker cash generation because of:
- High working-capital requirements
- Large capital expenditures
- Changes in receivables
- Inventory investment
Therefore, investors should analyze Interest Coverage Ratio and Free Cash Flow together.
What Is a Good Interest Coverage Ratio?
There is no single ratio that is appropriate for every company.
As a general educational framework:
| Interest Coverage | General Interpretation |
|---|---|
| Below 1x | EBIT does not fully cover interest |
| 1–2x | Relatively limited cushion |
| 2–4x | Moderate coverage |
| 4–6x | Generally stronger coverage |
| Above 6x | Large earnings cushion |
These ranges are not universal investment rules. Industry conditions, earnings stability, debt structure, and economic conditions should always be considered.
Why Industry Context Matters
Different industries use debt differently.
Capital-intensive businesses may naturally require more borrowing to finance:
- Factories
- Machinery
- Infrastructure
- Energy projects
- Expansion
Therefore, comparing an industrial company with a low-debt technology company may produce misleading conclusions.
A better approach is to compare a company with:
- Its own historical ratios
- Direct competitors
- Industry averages
- Similar business models
Interest Coverage During Rising Interest Rates
Interest coverage becomes particularly important when financing costs rise.
If interest rates increase, companies with variable-rate debt may experience higher interest expenses.
If operating earnings remain unchanged while interest costs rise, the Interest Coverage Ratio can decline.
For example:
EBIT = Rs. 600M
If interest expense rises from:
Rs. 100M → Rs. 150M
Then coverage changes from:
6x → 4x
The company still covers its interest expense, but its financial cushion has become smaller.
Interest Coverage and Earnings Declines
Investors should also perform a simple stress test.
Suppose:
- EBIT = Rs. 500M
- Interest Expense = Rs. 100M
- Coverage = 5x
If EBIT falls by 40%:
- New EBIT = Rs. 300M
- Interest Expense = Rs. 100M
- Coverage = 3x
The company still covers interest, but its margin of safety has decreased.
This illustrates why investors should look at earnings stability, not just the current ratio.
Where Can Investors Find the Information?
PSX investors can generally find the relevant figures in a company's financial statements.
Look for:
- Operating profit
- EBIT or earnings before interest and taxes
- Finance costs
- Interest expense
- Borrowings
- Long-term debt
- Short-term debt
Annual reports and periodic financial statements can provide the information required for deeper analysis.
Common Mistakes Investors Make
Mistake 1: Looking Only at Total Debt
The amount of debt does not tell the whole story.
You also need to understand the company's ability to service that debt.
Mistake 2: Ignoring Interest Costs
Two companies with similar debt levels may face very different interest expenses.
Mistake 3: Using One Year's Ratio
A single year's Interest Coverage Ratio may not reveal the underlying trend.
Review several years whenever possible.
Mistake 4: Ignoring Cash Flow
Operating earnings are important, but cash generation also matters.
Mistake 5: Comparing Different Industries
Always consider industry-specific debt requirements and business models.
Financial Metrics to Analyze With Interest Coverage Ratio
For a more complete company analysis, review:
- Debt-to-Equity Ratio
- Free Cash Flow
- Operating Cash Flow
- Current Ratio
- Quick Ratio
- Return on Equity (ROE)
- Return on Assets (ROA)
- Earnings Per Share (EPS)
- Net Profit Margin
- P/E Ratio
- P/B Ratio
- Dividend Payout Ratio
Combining these metrics can provide a more comprehensive view of financial strength and investment risk.
How PSX Investors Zone Helps Investors
At PSX Investors Zone, we publish practical educational resources covering:
- Pakistan Stock Exchange
- Fundamental Analysis
- Financial Ratios
- Company Analysis
- Financial Statements
- Stock Valuation
- Long-Term Investing
- Risk Management
- Dividend Analysis
- Shariah-Compliant Investing
Our goal is to help investors understand the fundamentals behind a company and make informed investment decisions based on research rather than speculation.
Key Takeaways
- Interest Coverage Ratio measures a company's ability to cover interest expenses with operating earnings.
- A higher ratio generally indicates a larger earnings cushion.
- A ratio below 1x means EBIT does not fully cover interest expense.
- Debt-to-Equity and Interest Coverage measure different aspects of financial risk.
- Free Cash Flow should also be reviewed because earnings do not always equal cash.
- Industry comparisons and historical trends are essential.
- No single financial ratio should be used as a standalone investment decision.
Frequently Asked Questions
What is the Interest Coverage Ratio?
It measures how many times a company's operating earnings can cover its interest expense.
How is Interest Coverage Ratio calculated?
The common formula is:
Interest Coverage Ratio = EBIT ÷ Interest Expense
What does an Interest Coverage Ratio of 5x mean?
It means the company's EBIT is approximately five times its interest expense.
Is an Interest Coverage Ratio below 1 bad?
It indicates that EBIT is insufficient to cover interest expense for that period. It is an important warning sign, although investors should examine the company's complete financial position before reaching a conclusion.
What is a good Interest Coverage Ratio?
There is no universal number. A higher ratio generally provides greater protection, but the appropriate level depends on the industry, business model, earnings stability, and debt structure.
Is Interest Coverage Ratio better than Debt-to-Equity Ratio?
Neither is universally better. They measure different things. Debt-to-Equity measures leverage, while Interest Coverage measures the ability to service interest from operating earnings.
Conclusion
The Interest Coverage Ratio is an important financial metric for investors who want to understand how comfortably a company can handle its interest obligations.
A company with strong and stable operating earnings relative to its interest expense generally has a greater financial cushion. However, investors should not rely on this ratio alone.
For a complete analysis, combine Interest Coverage with Debt-to-Equity, Free Cash Flow, Operating Cash Flow, profitability ratios, liquidity ratios, and valuation metrics.
Understanding how debt affects a company's financial position can help PSX investors make more disciplined and informed long-term investment decisions.
Educational Disclaimer: This article is for educational purposes only and does not constitute financial, investment, legal, tax, or Shariah advice. Investing in the Pakistan Stock Exchange involves risk, including the possible loss of capital. Always conduct your own research and consult qualified professionals before making investment decisions.